.png)
.png)
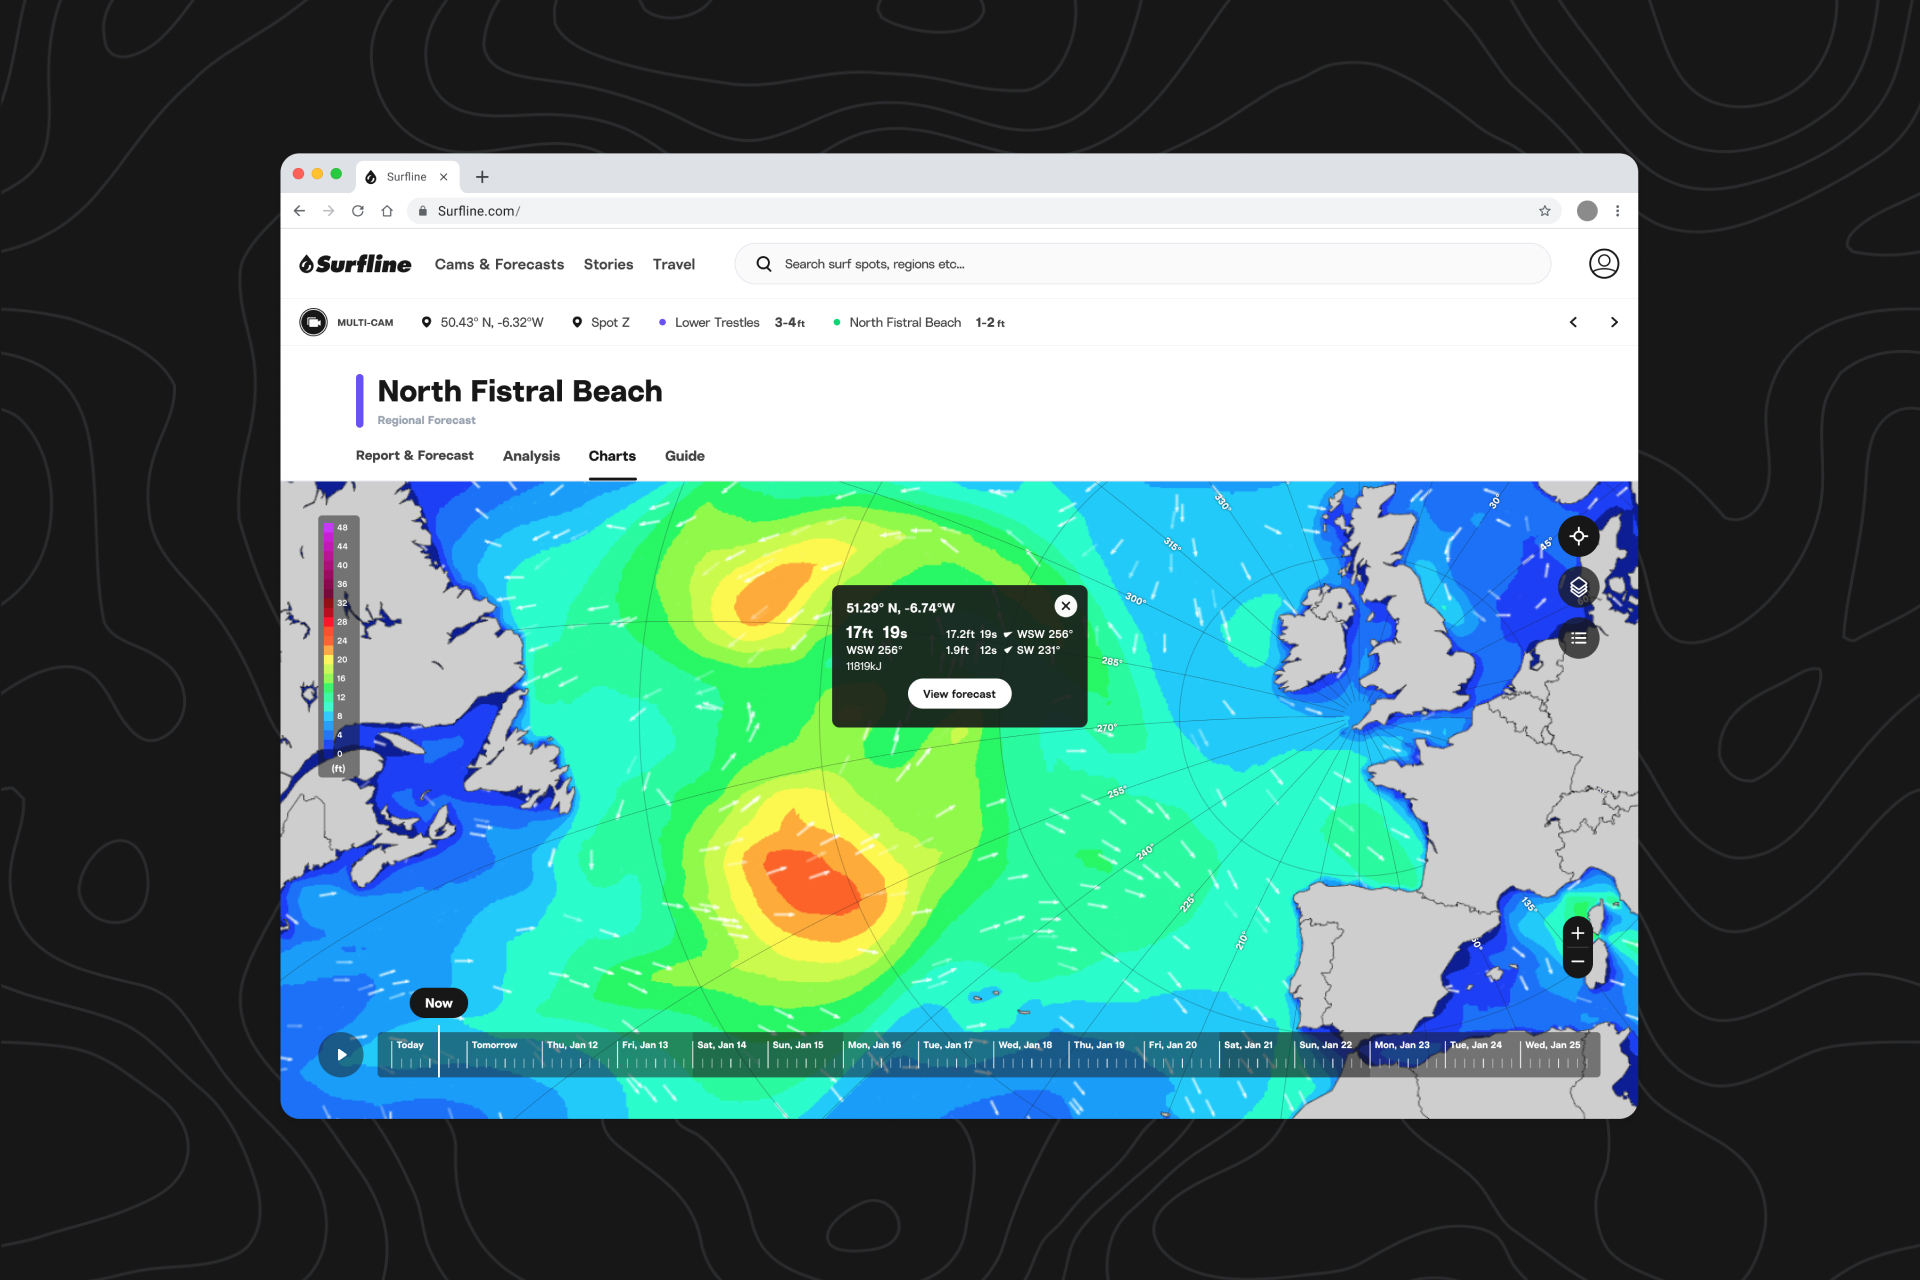
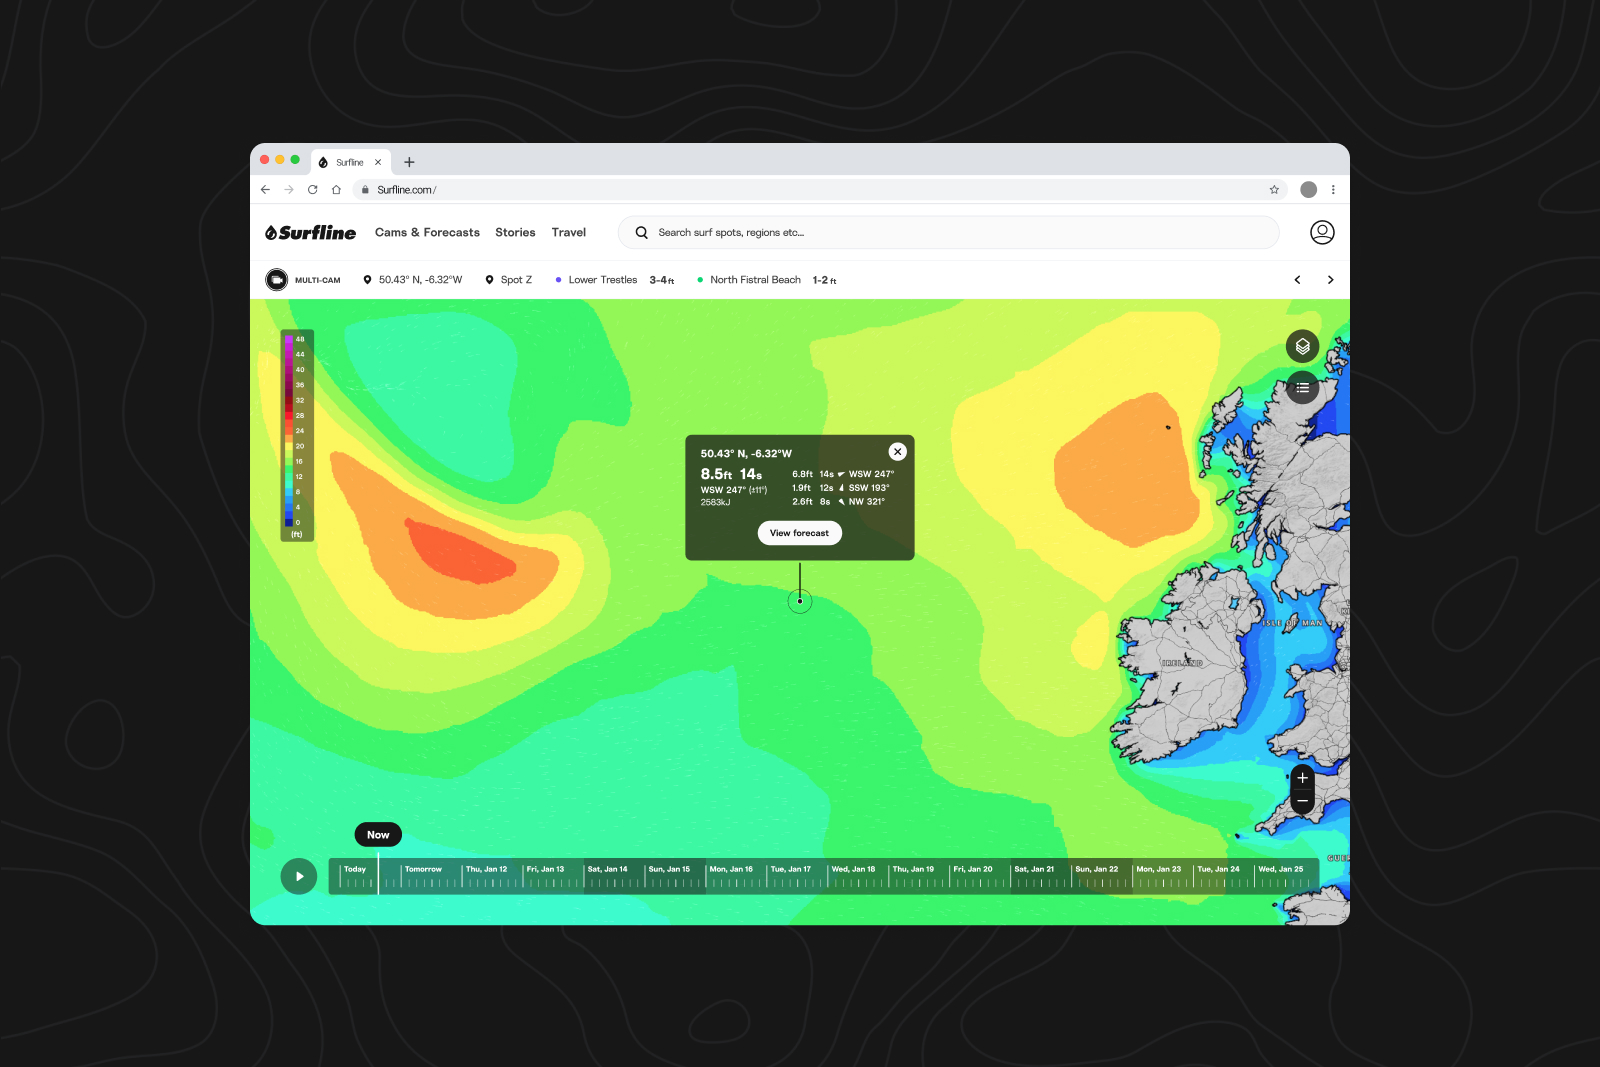
The forecast tells you what’s coming—Charts let you see it. Use Charts to visualize how swells are unfolding, and how they might show up in the areas you want to surf.
We've made updates to Charts that make it easier to interpret incoming swells, track wind shifts, and see how ocean patterns are interacting with the coast in real time—a visual complement to our WaveFax and forecaster analysis.
Now, you can view the data spread across an entire area, allowing you to see what our forecasters are talking about for yourself.
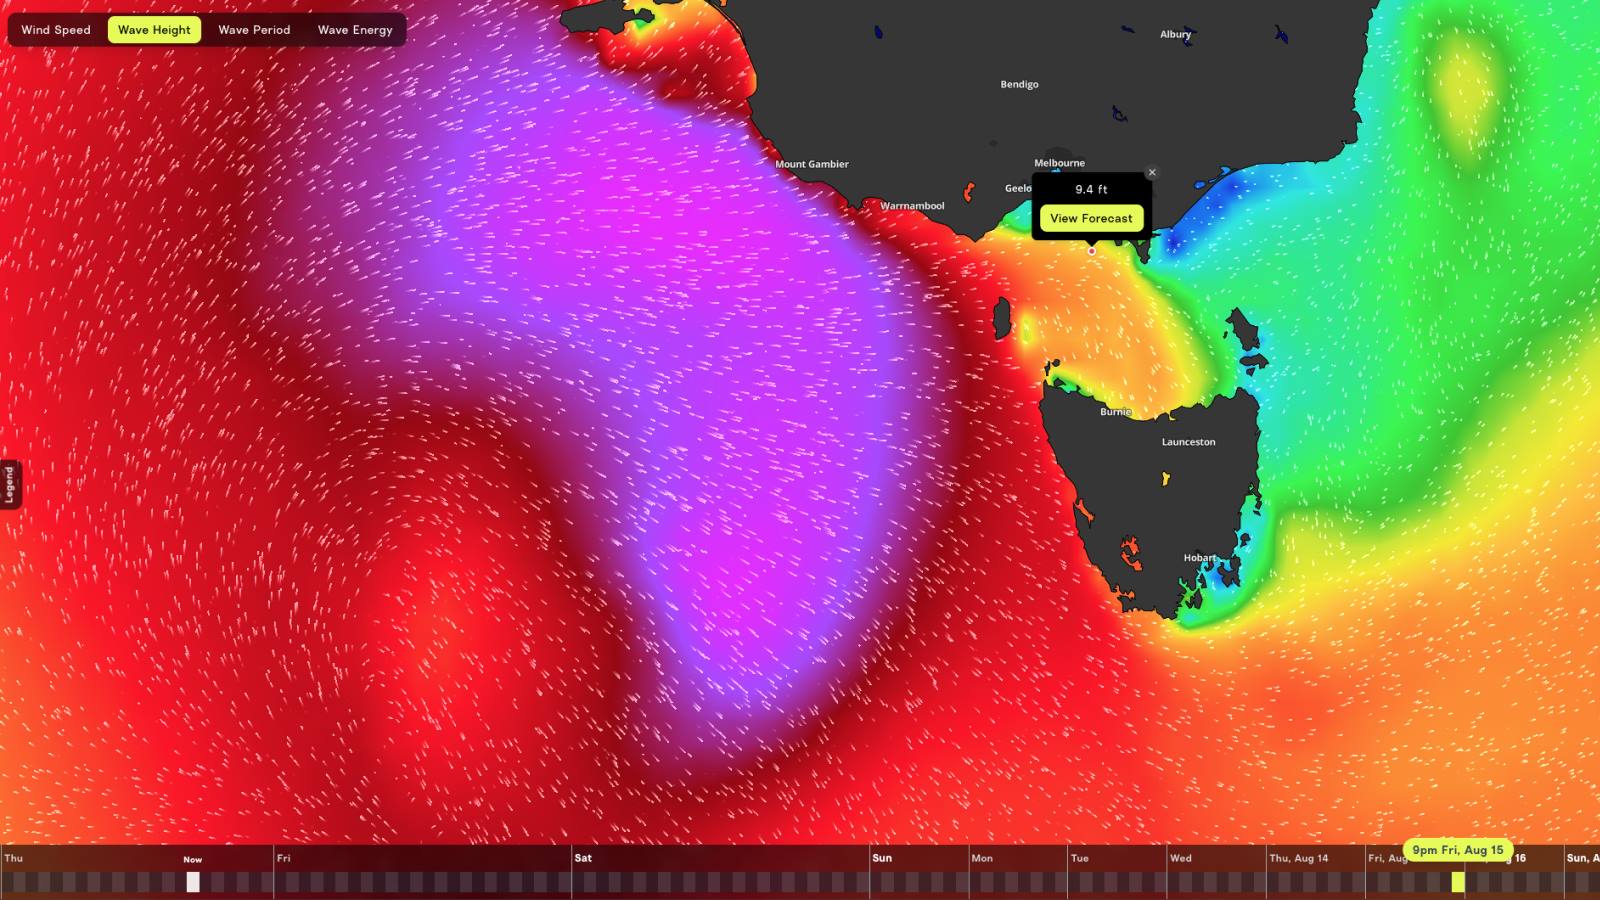
Whether you’re tracking familiar spots or scouting new ones, seeing how ocean energy moves towards the coast can help you time your session or choose the right window with more clarity.
Updates to the charts experience:
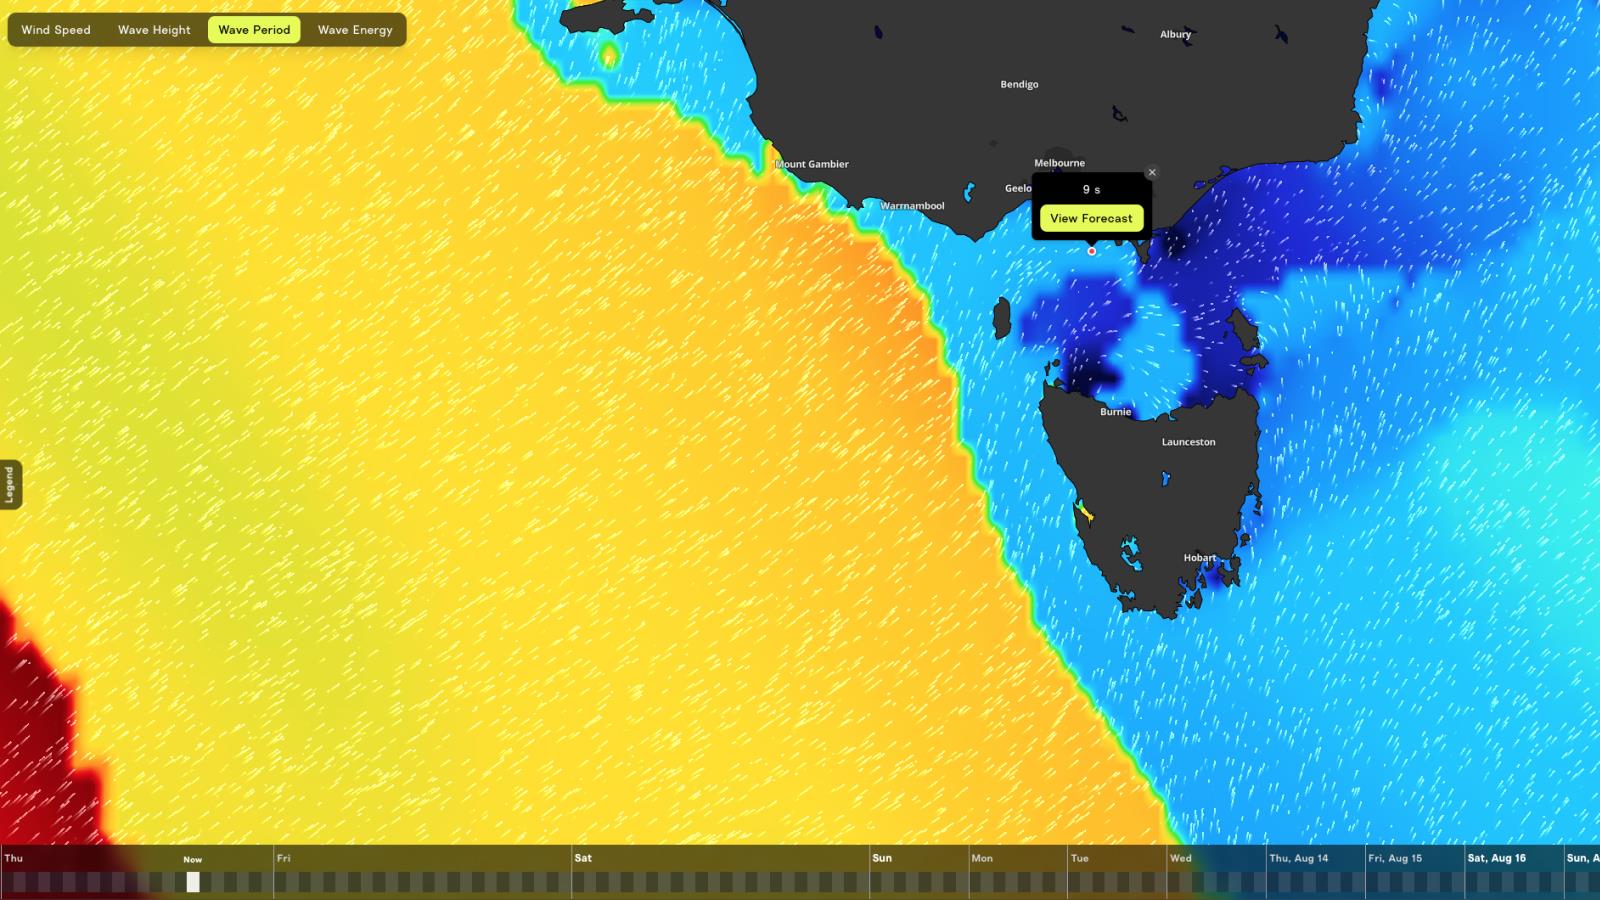
- Smooth interpolation across all data layers makes it easier to follow swell energy as it builds, moves, and wraps into the coast.
- Revised color scales make it easier to distinguish meaningful differences—like higher-impact wind zones or how swell refracts into your local spots.
Customize your view with new control options:
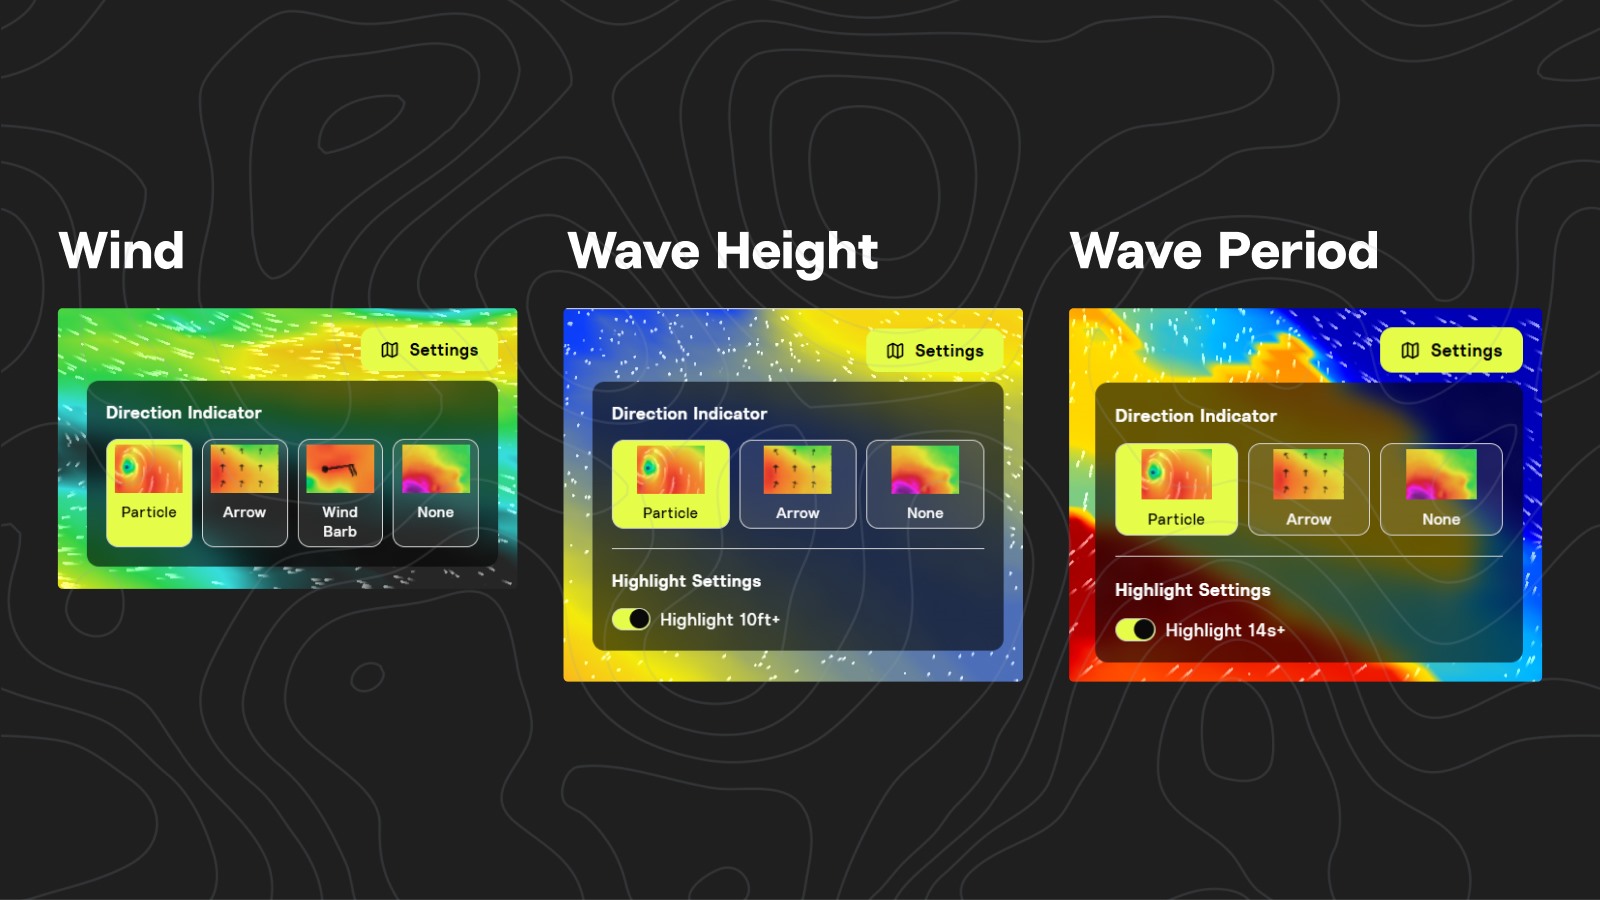
- Choose how wind direction is displayed (Arrow, Particle, Barb)
- Choose how swell, period, and energy are displayed (Arrow, Particle)
- Highlight significant thresholds like 10ft+ wave heights or 14s+ periods.
Where to find Charts:
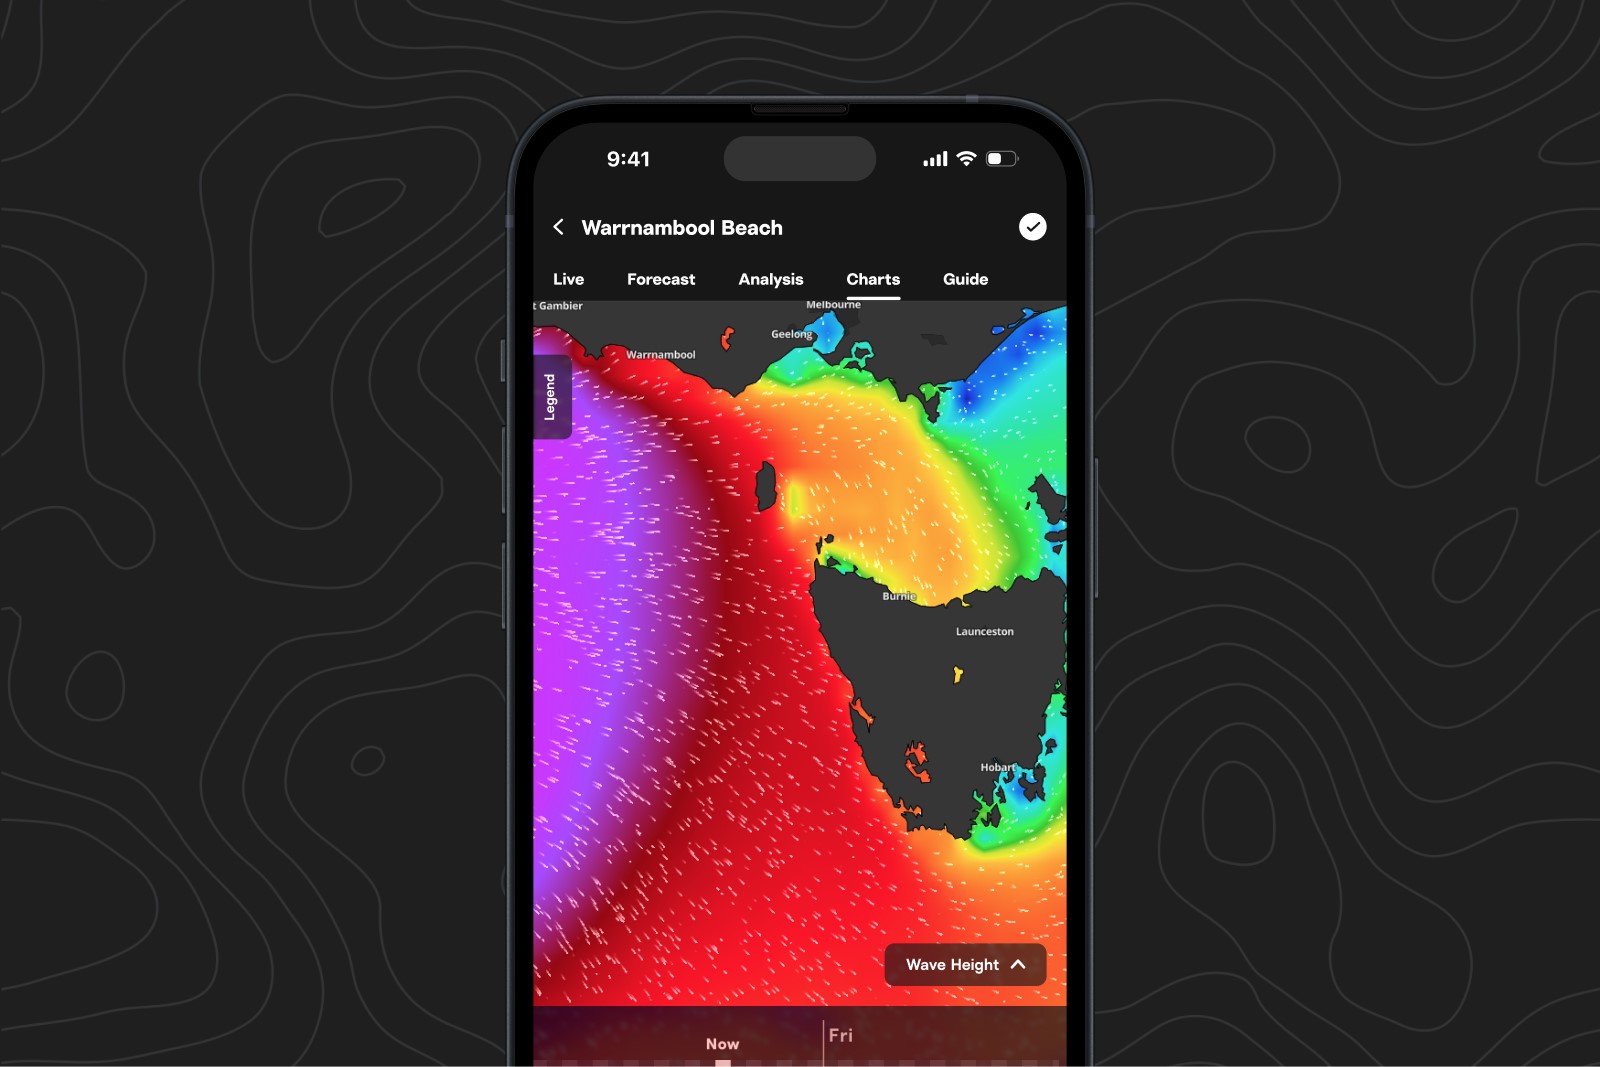
On iOS or Android, go to any spot page and tap the Charts tab.
On Web, do the same, or navigate to Maps → Charts from the homepage.
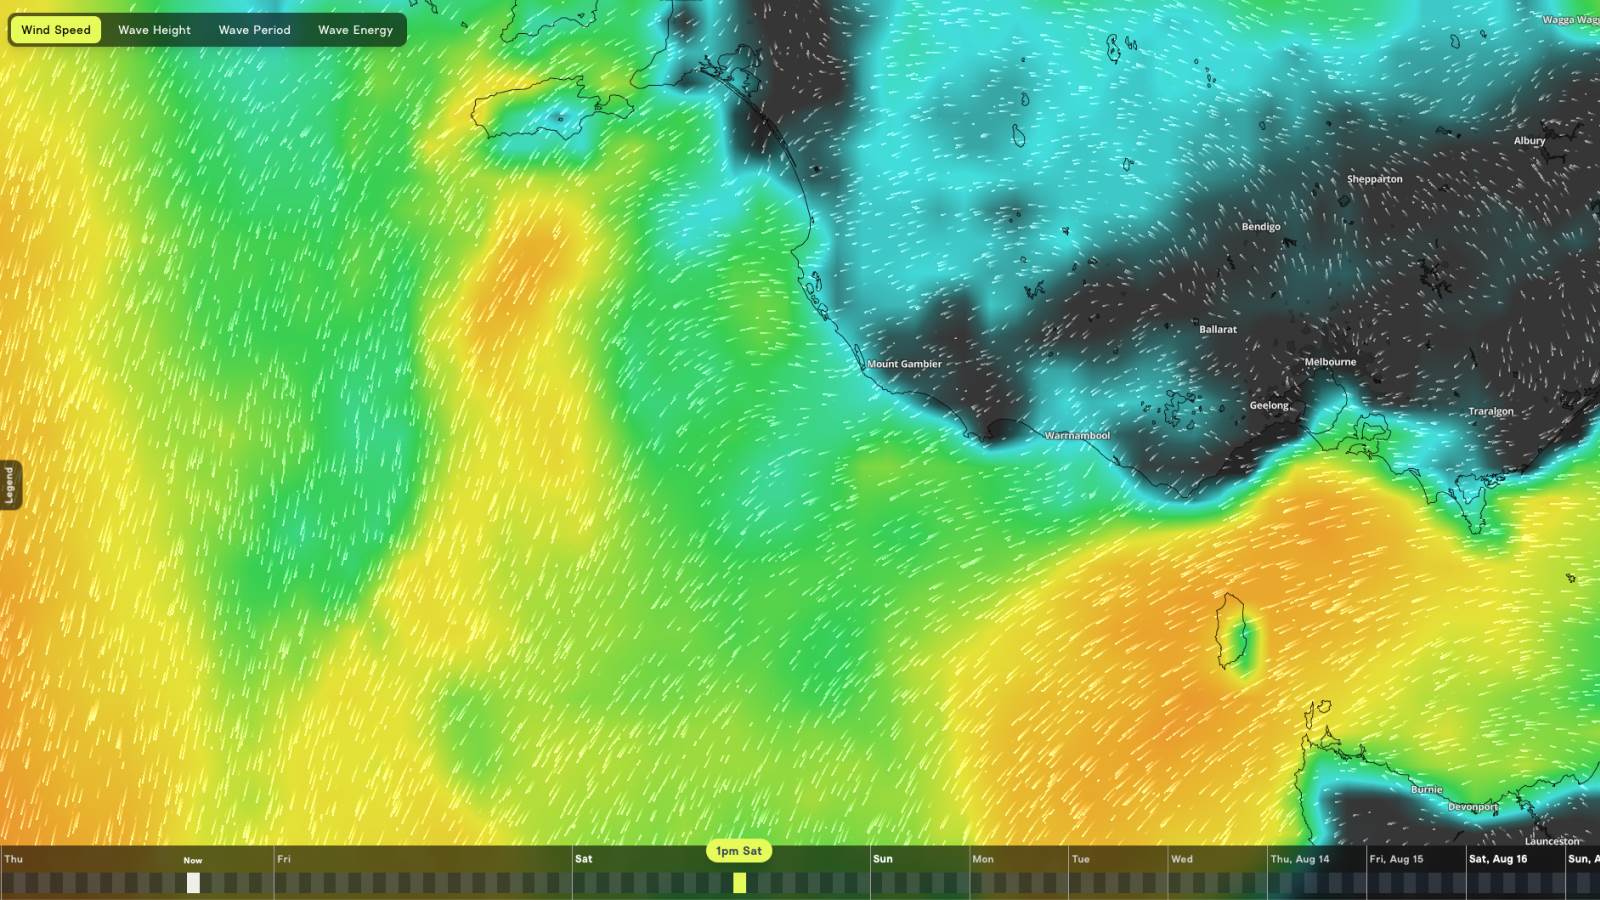
From there, you can zoom, scroll, and switch between four views: Wind Speed, Wave Height, Wave Period, and Wave Energy.
How to use Charts:
Charts let you see the ocean the way our forecasters see it, turning numbers and data into a clear picture you can use to plan better sessions. Here are some ways we recommend using them:
1. Spot and track storms and swells
Follow incoming swells so you can clear your schedule and be ready.
See the latest model forecast and track a swell from where it starts to when it reaches your break. Use Wind Speed layer to see the fetch aimed at your region, and Wave Height and Wave Period layers to see how storms send energy across oceans.
Check back frequently to see changes in a storm’s track or intensity, and how these changes impact the swell.
Example: Track a tropical storm (hurricane) forming near the Caribbean, see how the swell spreads around the North Atlantic based on the storm’s strength and track.
2. Dial in the best zones
Find the areas of the coast that will get the most swell.
Zoom in to find which stretches of coast will get the most swell based on direction and period. Notice shadowing from points, islands, or bathymetry that block or focus swell.
Example: A south swell shows larger wave heights (lighter blues) in Orange County and Malibu than in the LA/South Bay zone (darker blues) — make a short drive to find bigger waves.
3. Time your session
Hit the beach when conditions peak instead of showing up too early or too late.
Use Wave Period charts to see when and where long-period forerunners will arrive and when the main swell will fill in. Check how arrival times differ between nearby breaks so you can be in the right spot at the right time.
Example: Long-period swell from the SW South Pacific reaches Mainland Mexico a half day or so ahead of Central America, where you can see the Galapagos shadow some of the swell for Costa Rica. If planning a trip, see where the strongest swell is hitting and which zone will peak during daylight hours, not pass under darkness.
4. Catch local nuances
Spot small but important local wind and swell effects.
Zoom in to identify local effects like changes in the orientation of the coast and localized pockets of offshore wind, wind eddies, and sheltered zones behind mountains.
Example: Checking dawn patrol winds on Australia’s East Coast, you can see sideshore winds in northern NSW are more offshore for parts of the Gold Coast for cleaner surf.
5. Spot areas of high or low energy
Identify the areas that will be more exposed to incoming swell energy — or the places to escape it.
When there's an active storm pattern and multiple swells in the water, use the Wave Energy layer to visualize which areas will receive the most wave action, and where you can hide from the bulk of the energy while still finding a wave.
Example: The UK and Western Europe can have multiple storms and swells approaching at the same time, quickly see how Portugal and France are open to the most energy, while Spain is partially shadowed. Ireland sees NW swell but less energy from the stronger SW swell. Meanwhile, Cornwall and Wales are the reverse.