Spot-level improvements
Avalon 10-14th, NJ, United States
Let's take a look at the process of one of our recent updates to improve breaking wave height predictions at Avalon 10-14th in New Jersey:
First, we assess statistical bias and fix systematic errors to make adjustments to the model.
We compare historic forecaster observations of the surf height to breaking wave height predictions to understand how off our model is, and for which swells we are under or over-calling.
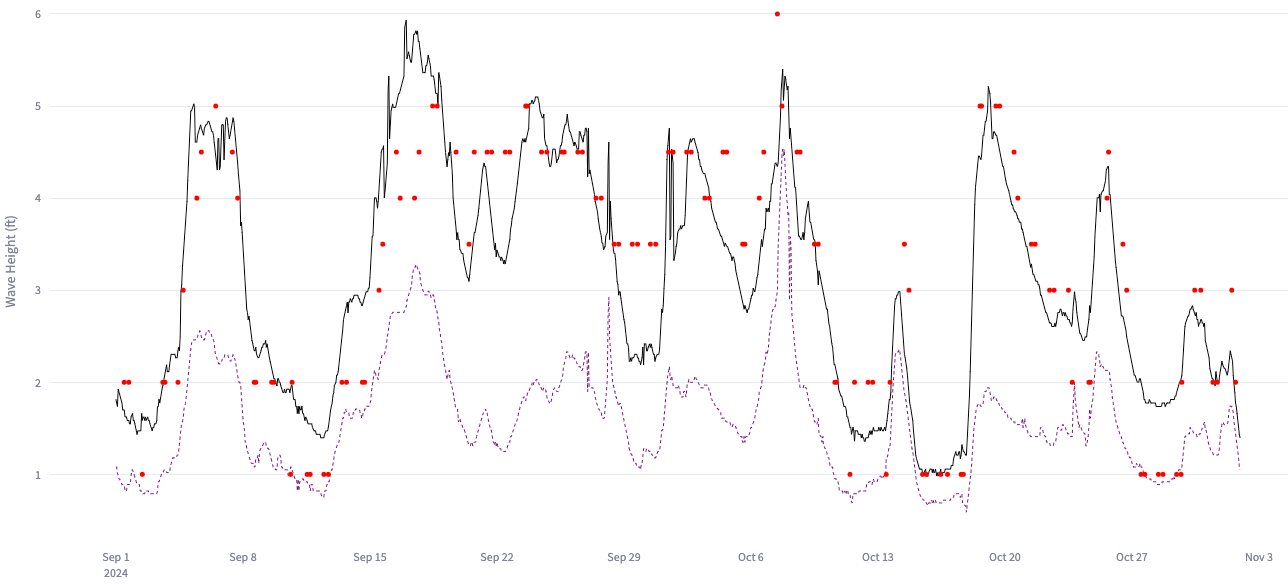
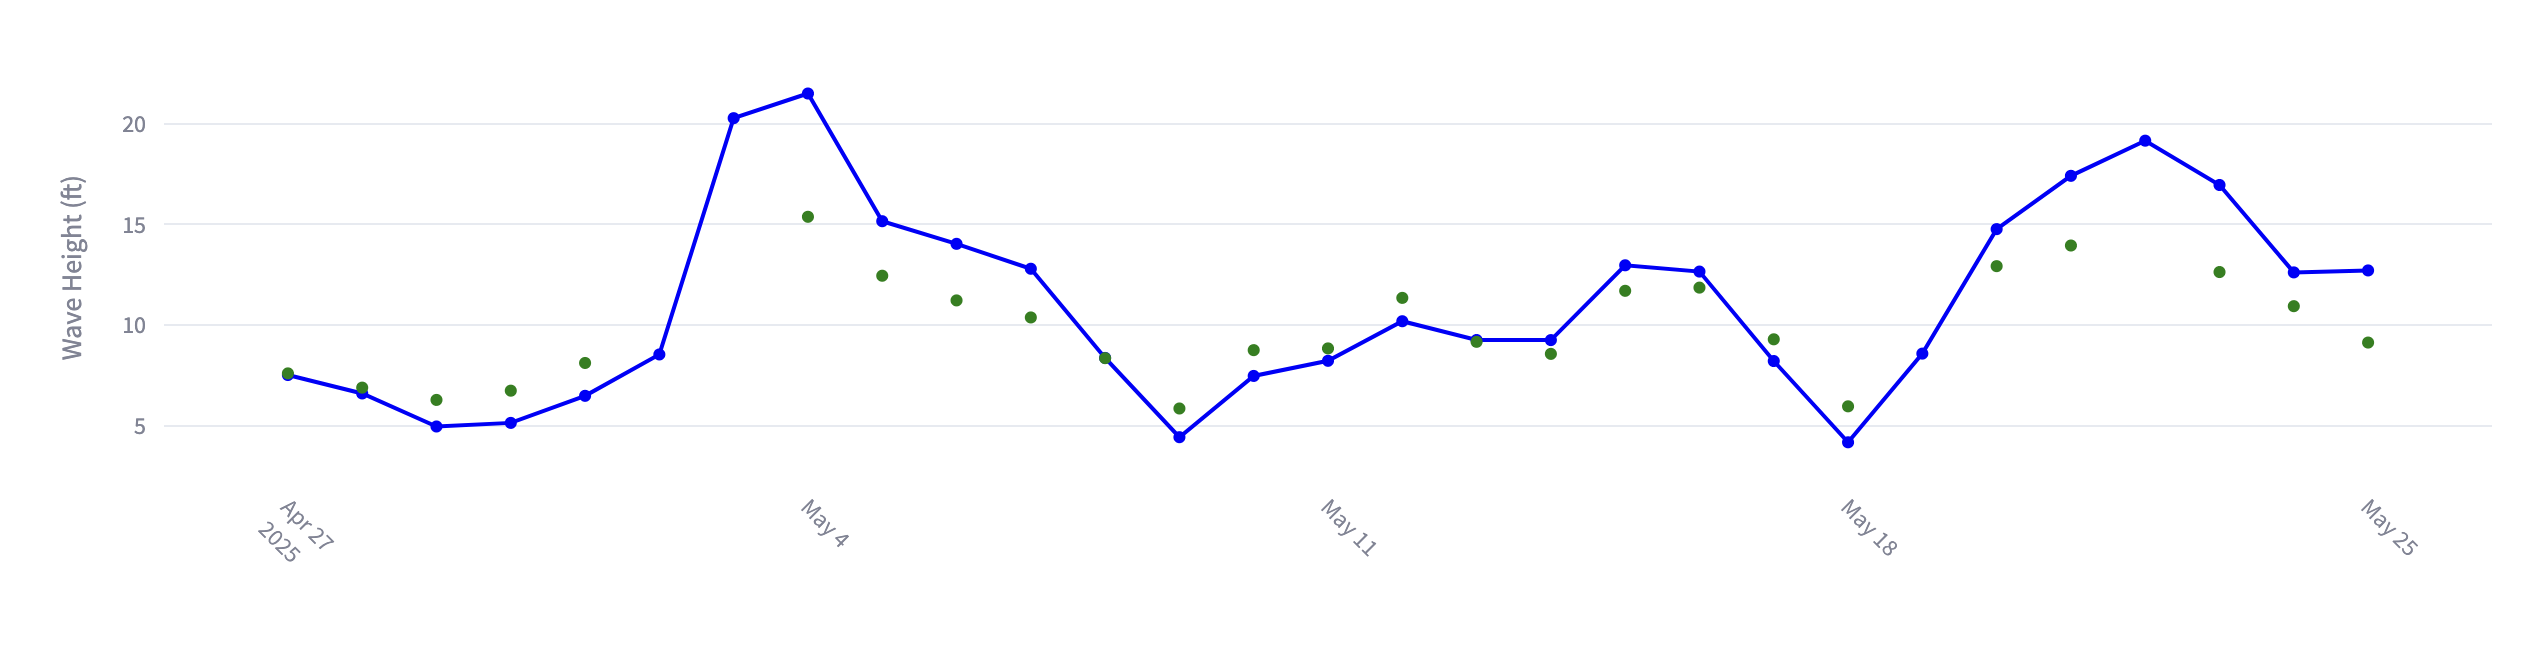
LOTUS breaking wave height predictions before (purple dashed line) and after (black solid line) adjustments during Fall 2024 at Avalon 10-14th.
We underperformed for some of the swells during this period, tending to under-call surf heights compared to observations (red dots).
Our adjustments bring the model outputs closer to ground truth—the observations our forecasters made.
After adjusting the model, we check that our changes reduce misses across all swell constellations and height ranges.
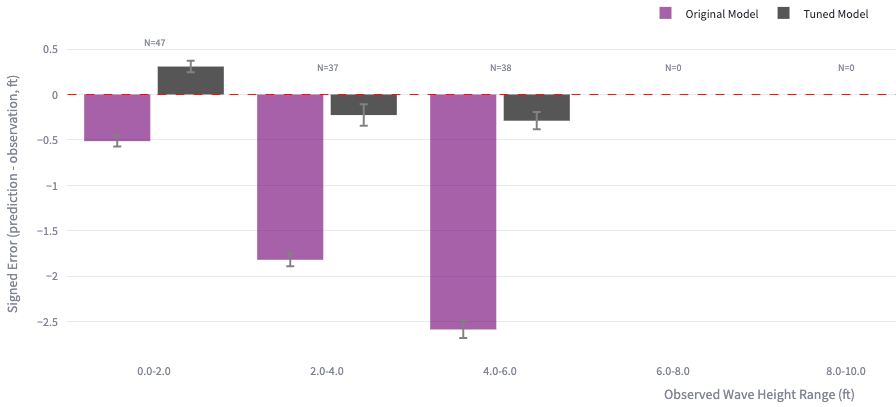
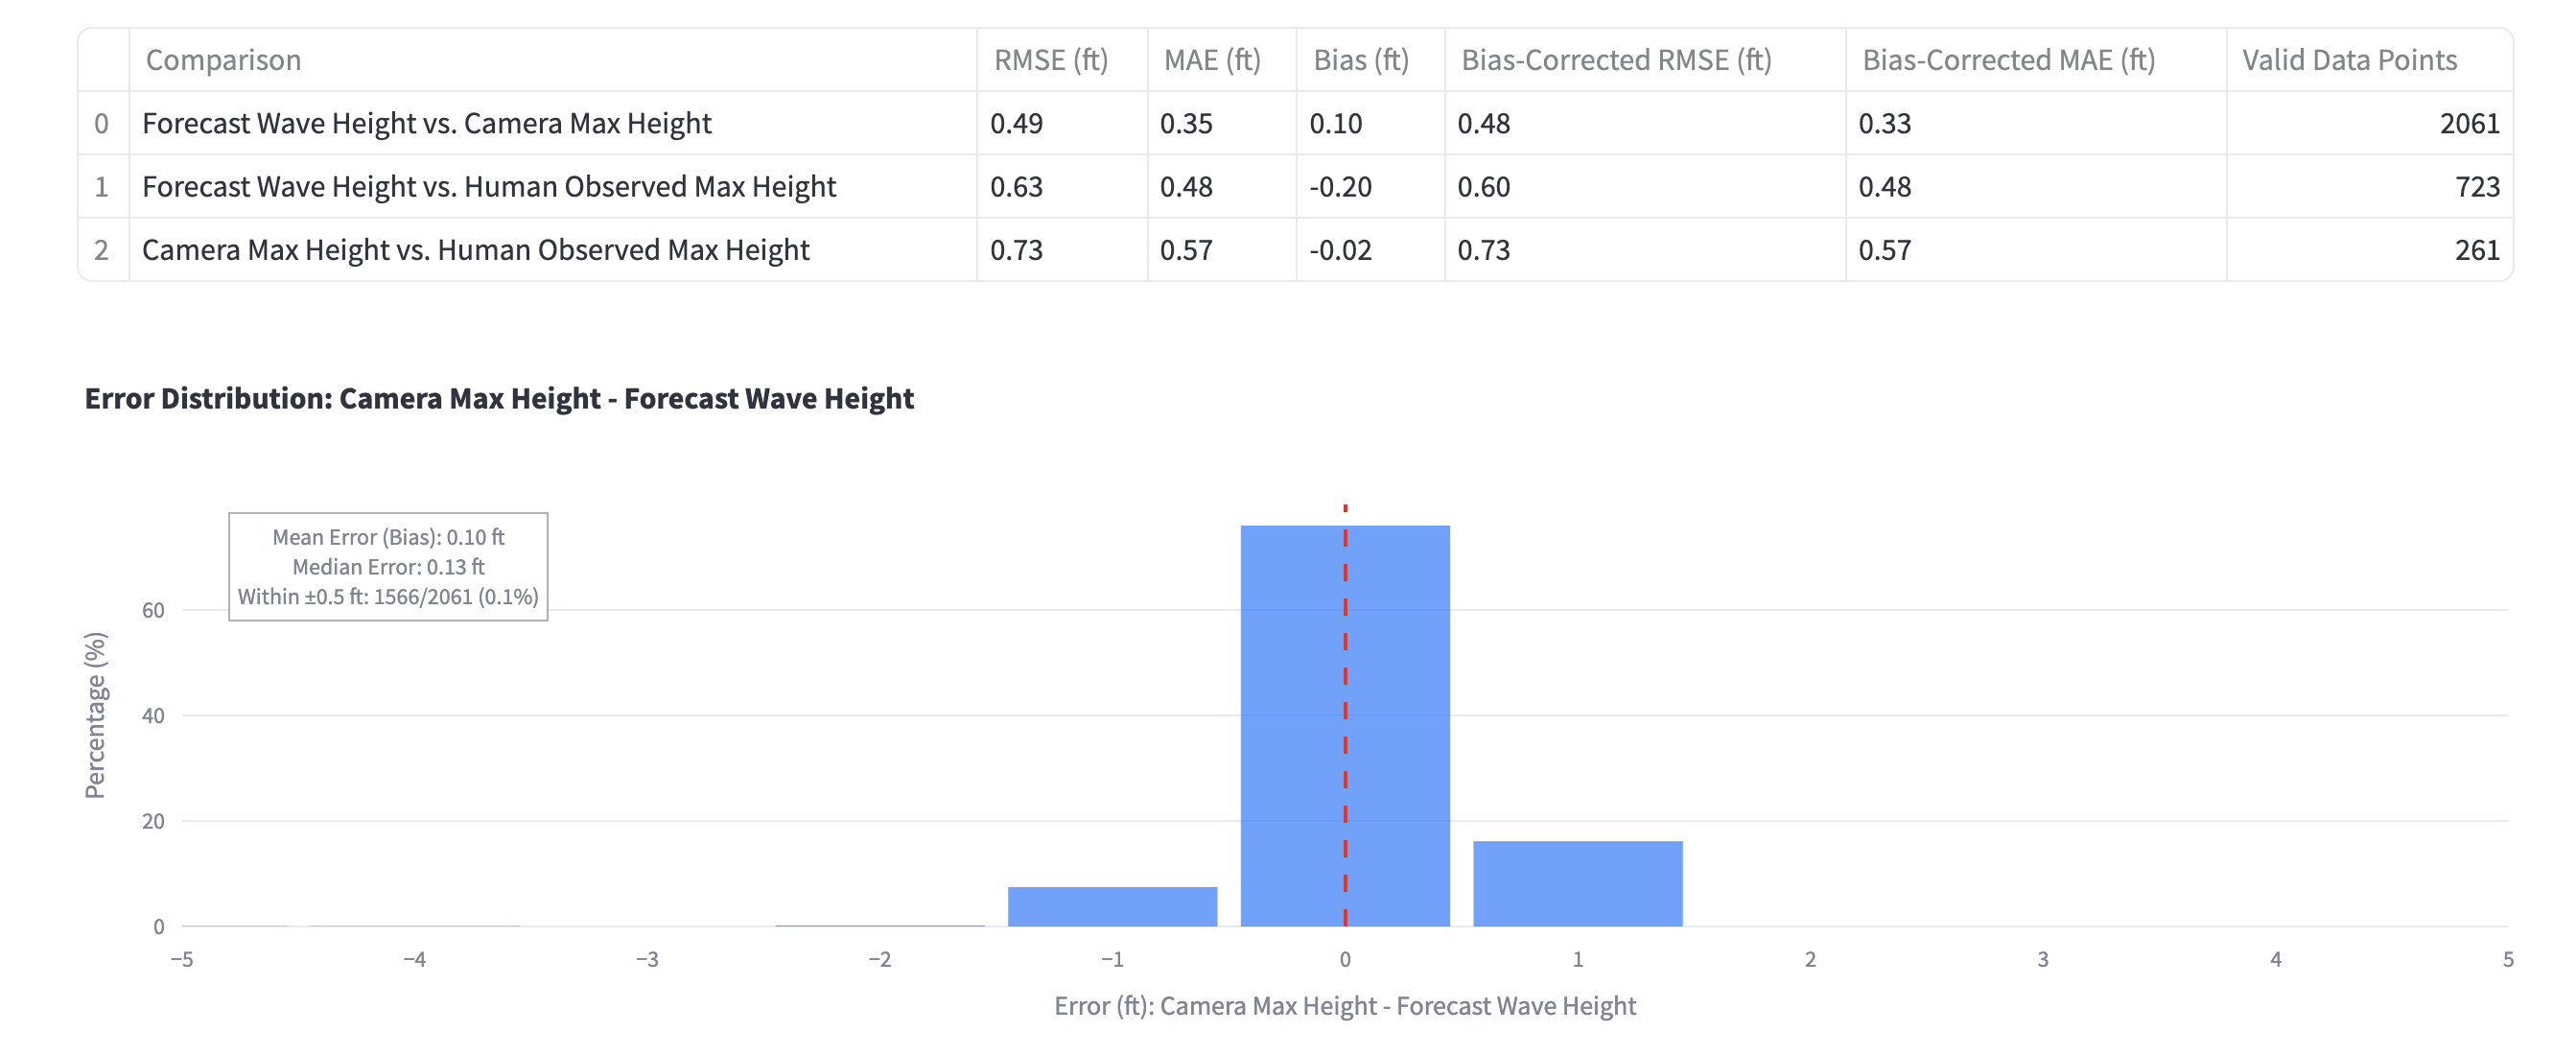
Visualization of significant error margins for specific surf height bands during the Fall 2024 time range at Avalon 10-14th.
The outcome is positive: We were able to reduce error across all surf height bands and reduced the overall mean-average error from 1.56ft to 0.51ft, a 68% improvement.
In other words, with these updates, the average error of predicted surf heights will be less than the height of a surfer's head.
We review the spot-level adjustments with our forecasters before updating to make sure adjustments account for all spot-specific factors.
We only push updates after confirming that the optimizations will work with spot-level nuances, including seasonal fluctuations and swell characteristics, recent changes of the beach’s bathymetry, tides, etc.
We only launch these changes where we have enough significant data and confidence that we are reliably and significantly improving the forecast outputs.
What's next?
As we continue to review and make these updates periodically to spots around the world, we’ll let you know when more adjustments are made.
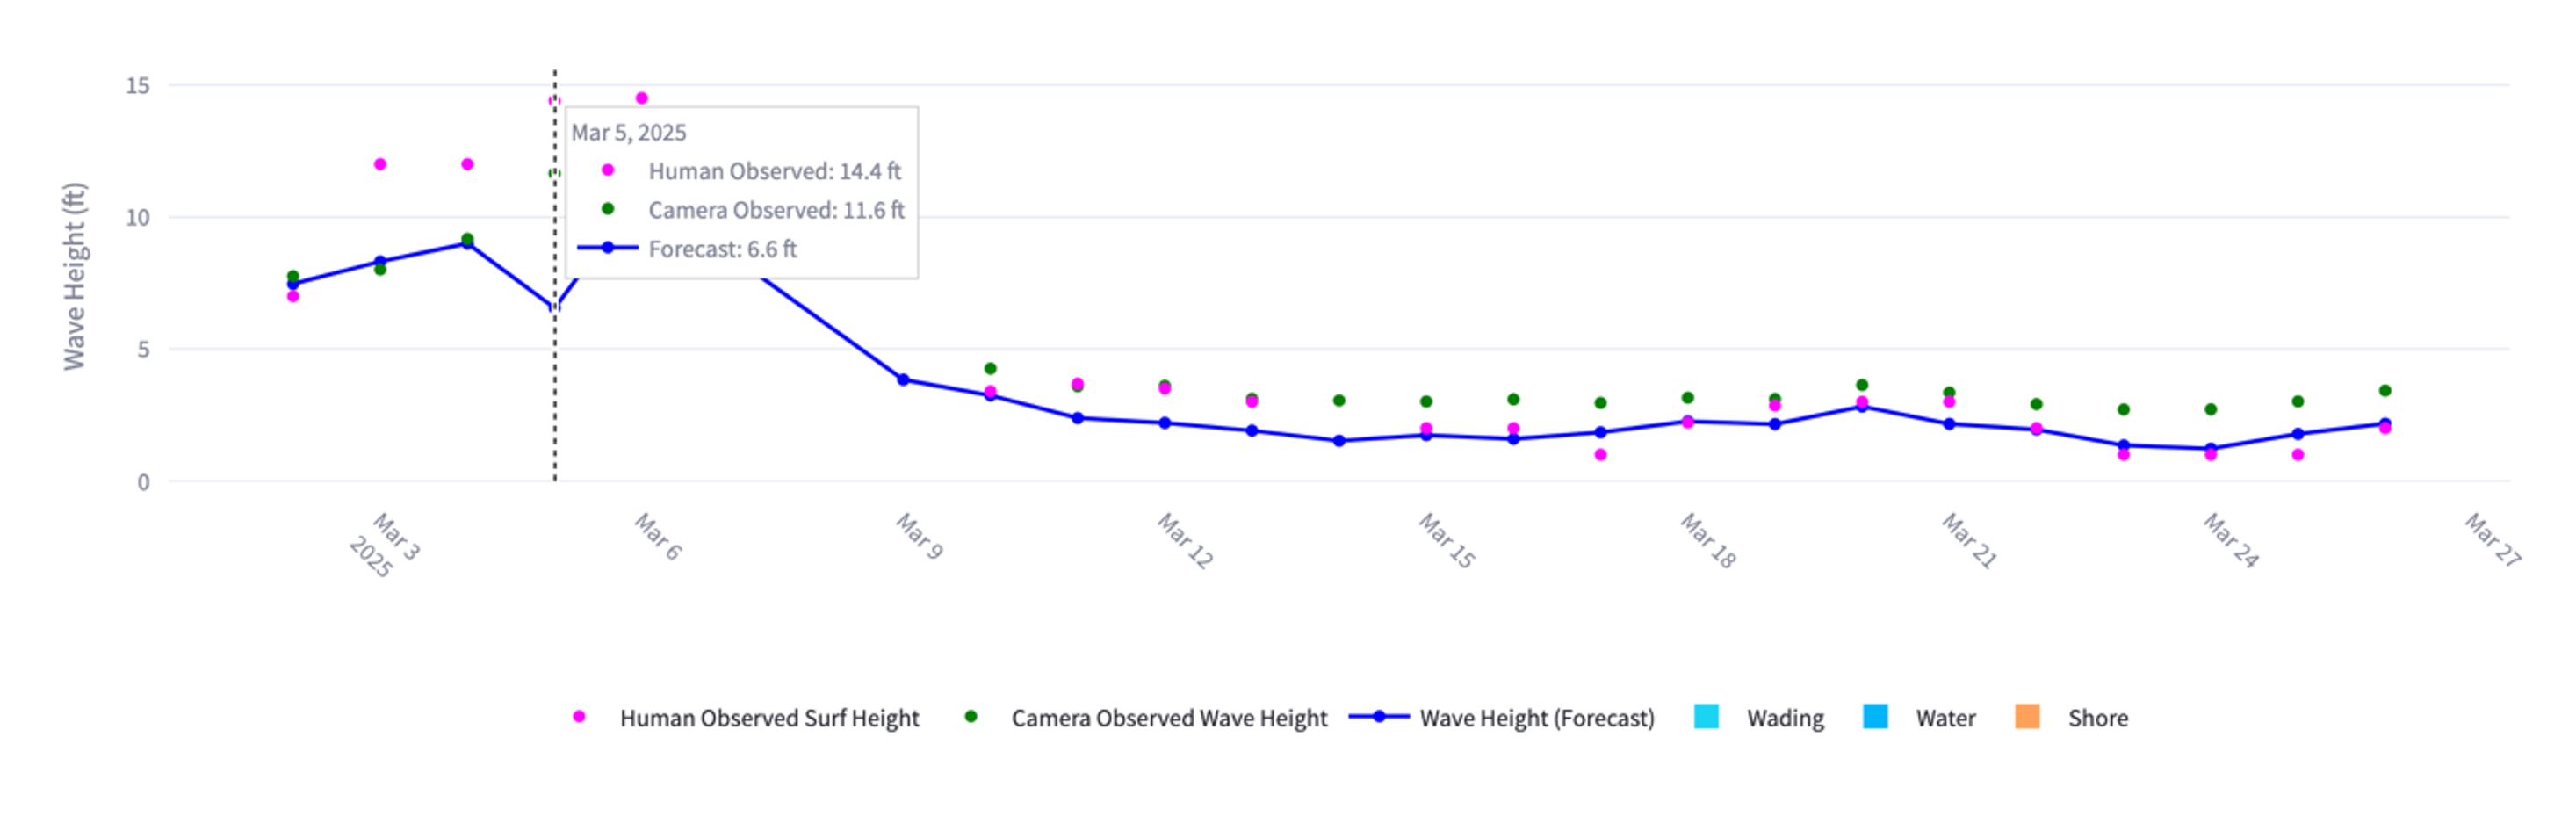
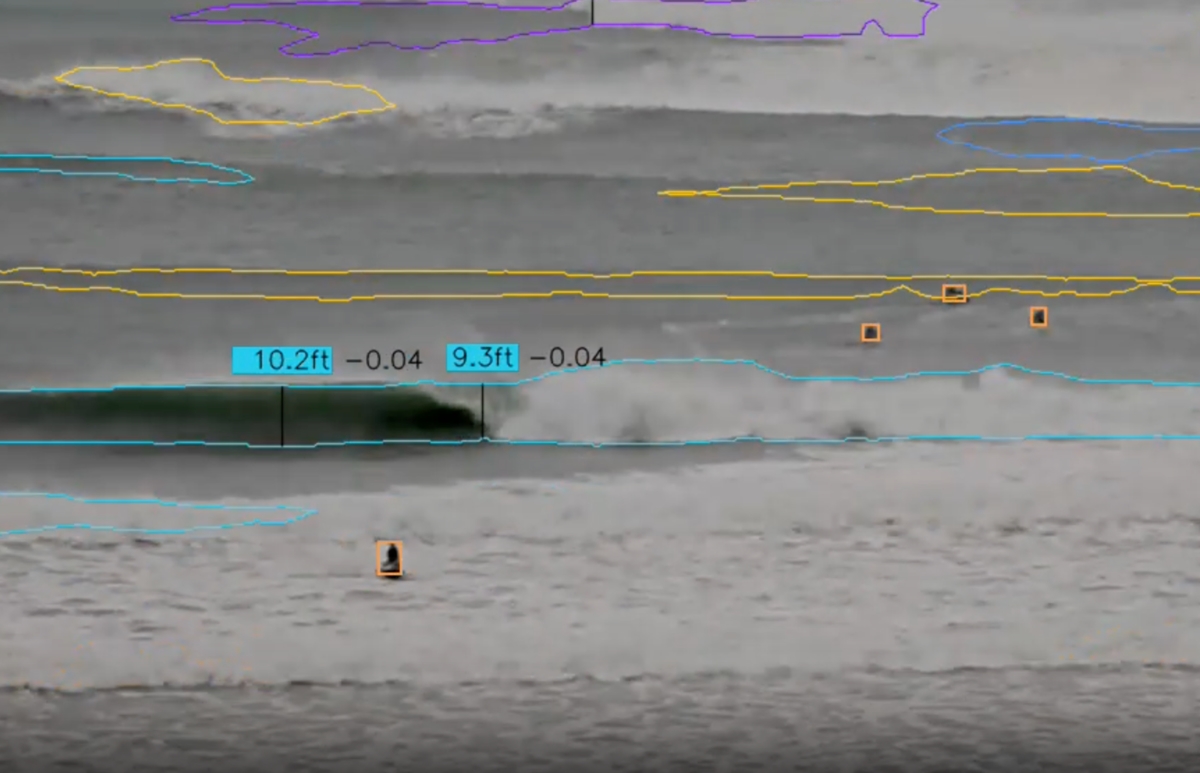
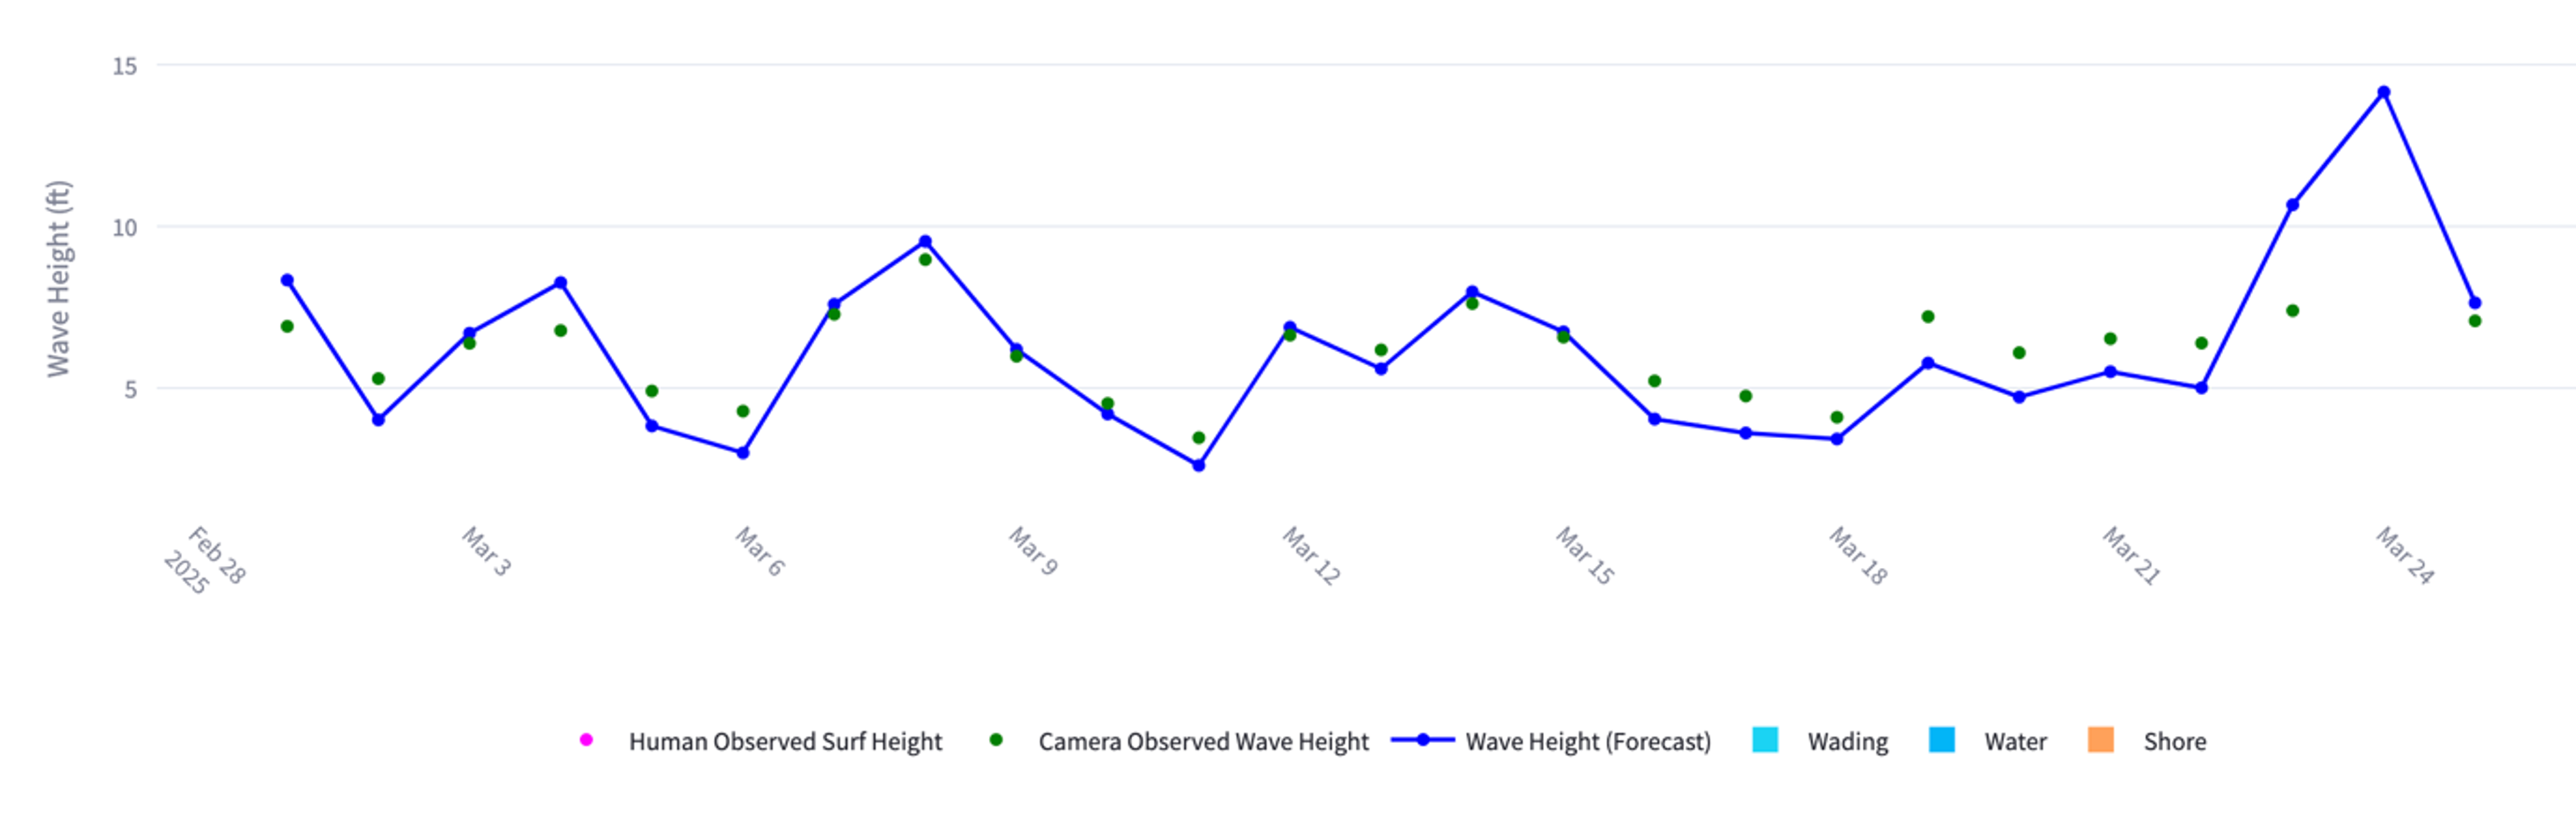
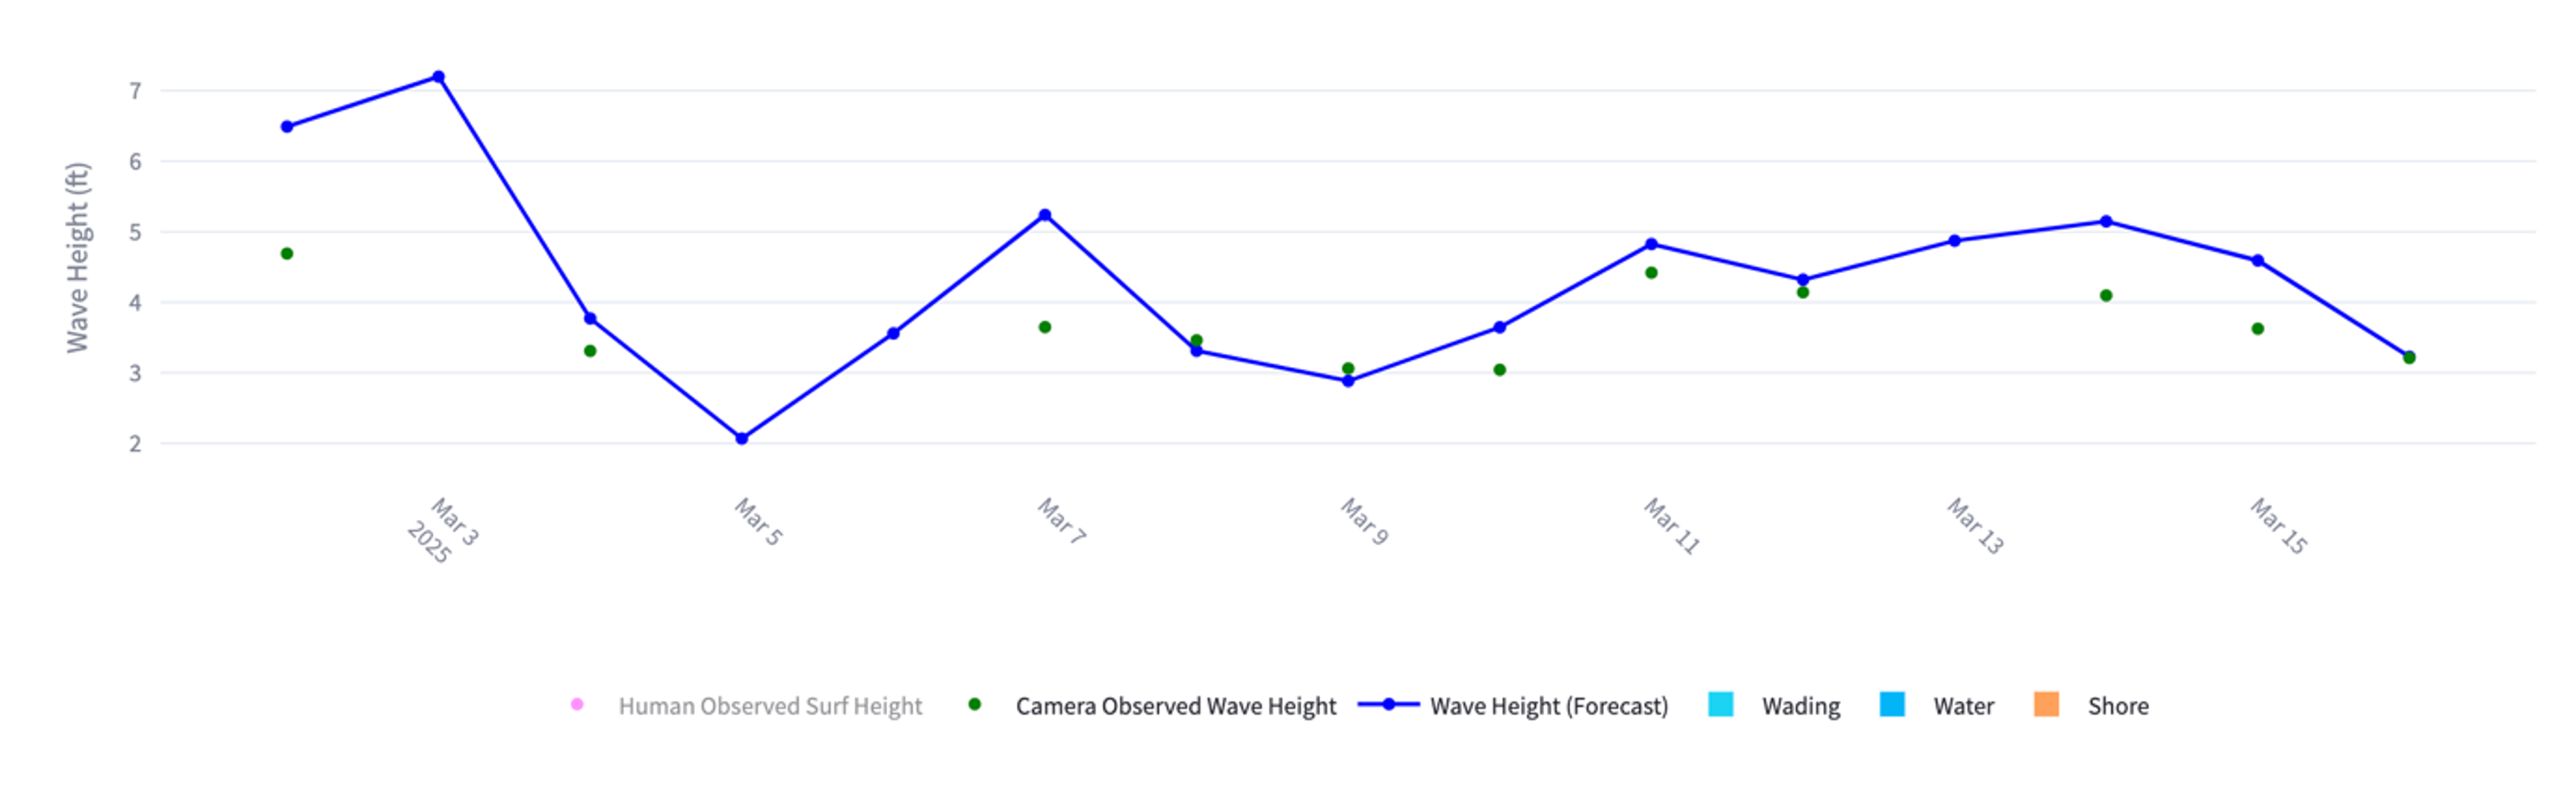
We’re beginning to incorporate Smart Cam observation data, which will allow us to increase the amount of real-time observations we can make at a spot - from 1-2 observations a day to observations up to every 10 minutes—so we can even better adjust our LOTUS forecast with more data.
We will also begin looking into accounting for more dynamic systems in the model itself, such as tides.
.png)
.png)